Table of Contents
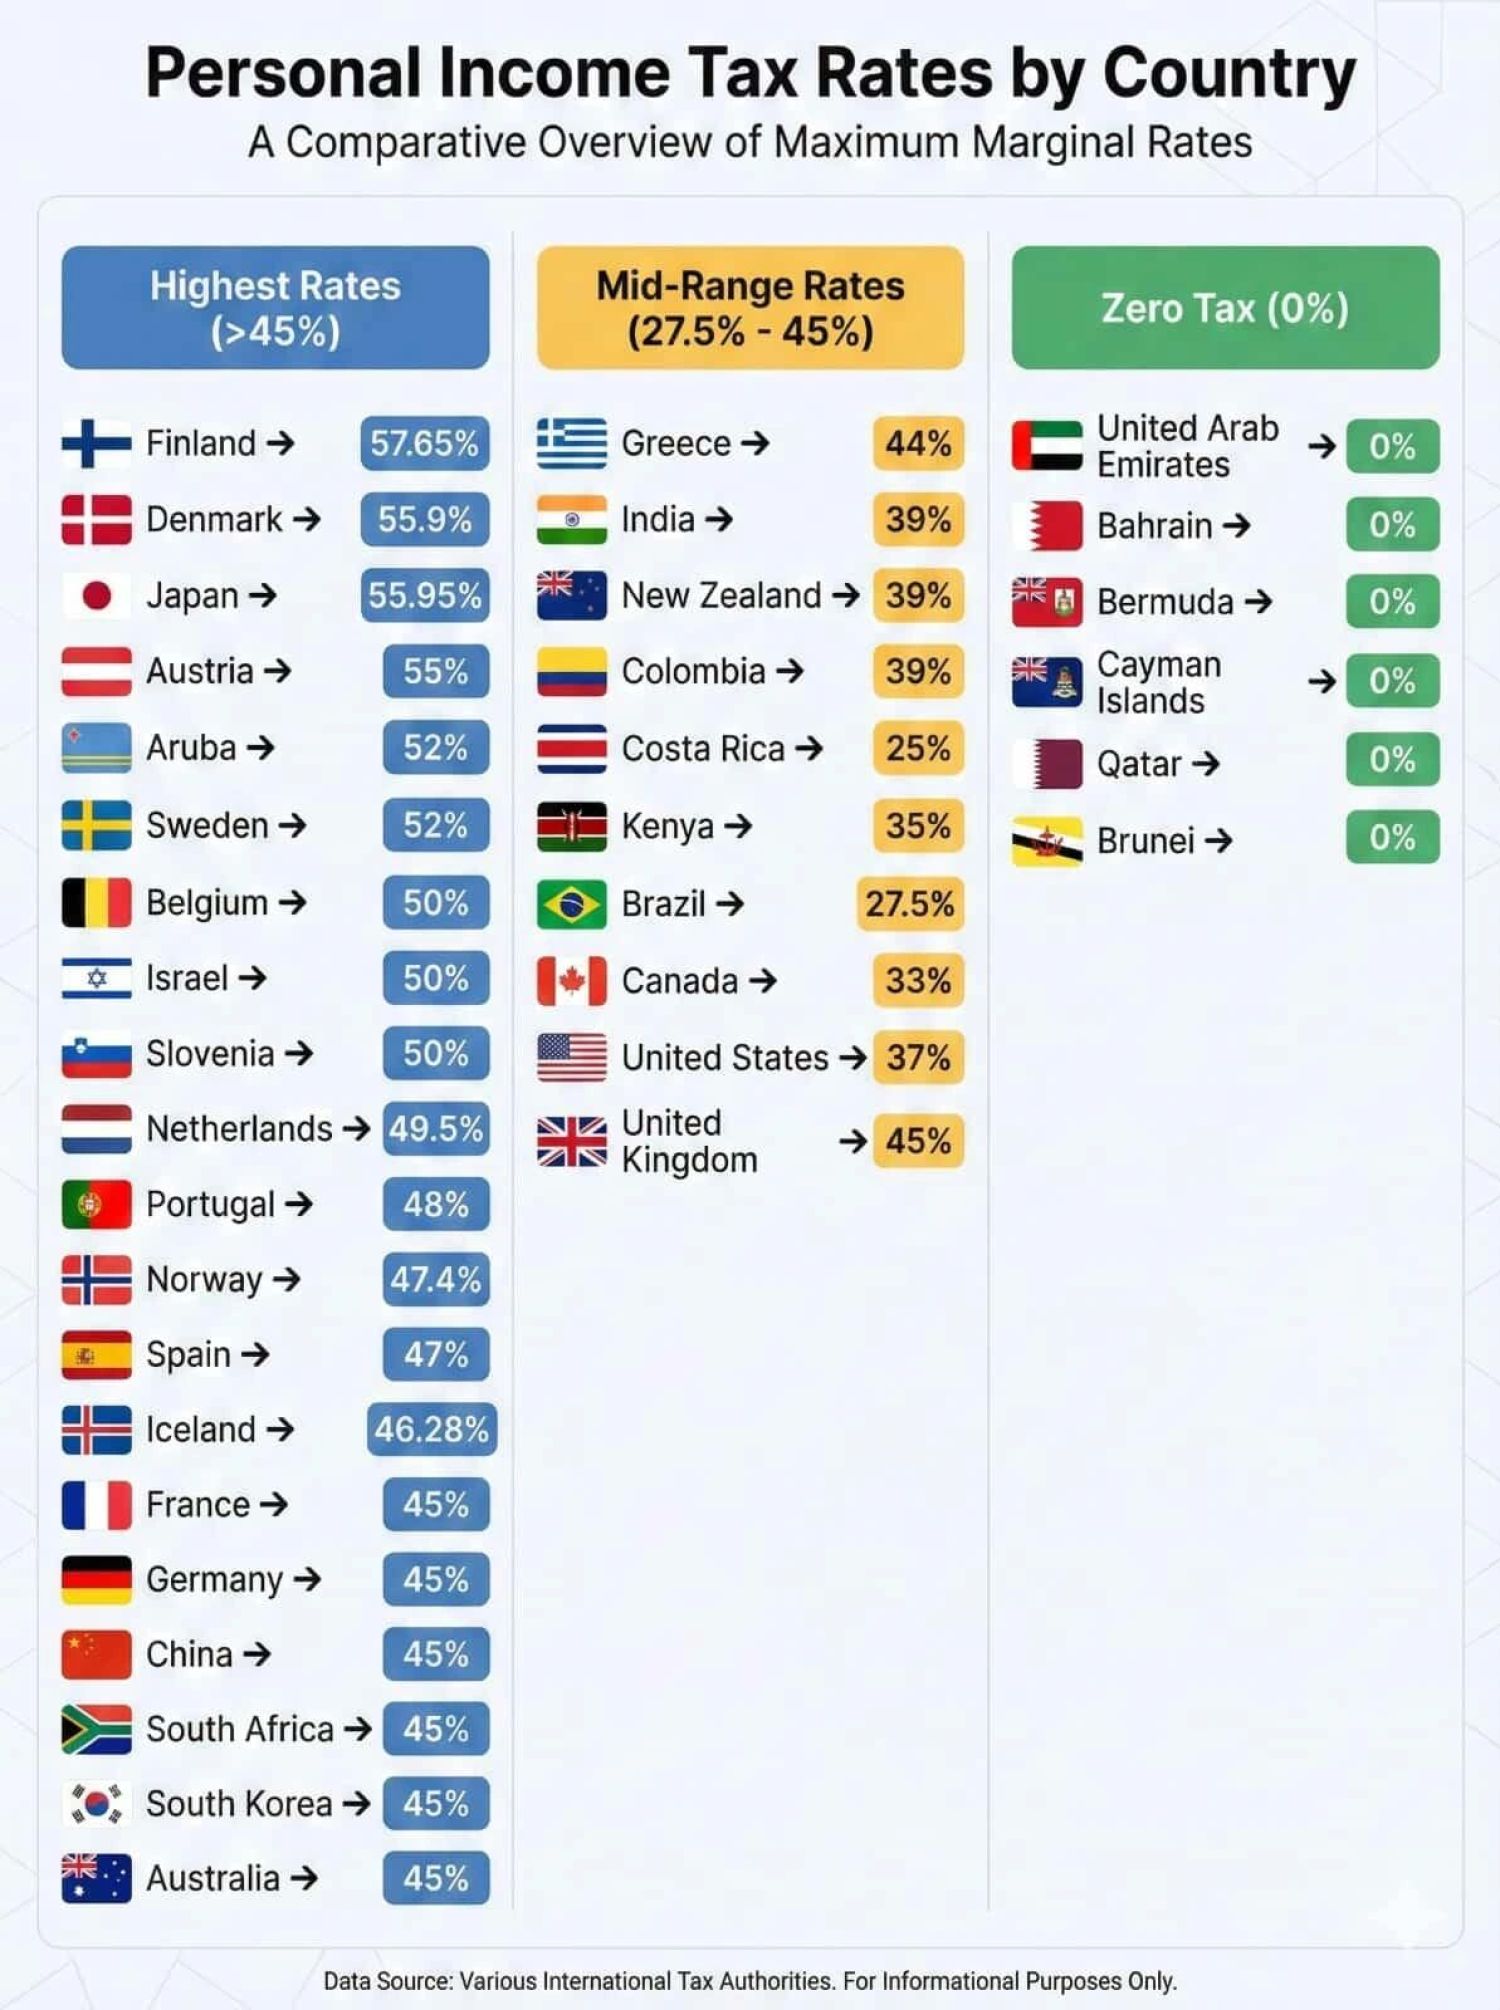
Top Personal Income Tax Rates Around the World (2025)
India at 39% falls in the mid-range category, similar to New Zealand and Colombia.
Nordic countries dominate the highest tax bracket (Finland, Denmark, Sweden). Tax havens and Gulf countries have zero personal income tax. & Global trend is Developed nations generally have higher rates; emerging economies like India have moderate rates.
High-Tax Countries (Europe & Beyond)
|
Country |
Top Personal Income Tax Rate |
|---|---|
|
Denmark |
55.9% — among the highest globally |
|
Finland |
55% |
|
Portugal |
53–54% |
|
Sweden |
52.3% |
|
Slovenia |
50% |
|
Netherlands |
49.5% |
|
Ireland |
48% |
|
Italy |
47.2% |
|
Germany |
47.5% |
|
France |
55.4% (combined rates) |
|
Spain |
54% |
Western and Northern European countries dominate the highest top rates globally, often above 45 %, reflecting extensive welfare states and progressive tax systems.
Several countries maintain top personal income tax rates exceeding 50% in 2025, primarily in Europe, reflecting progressive systems with surcharges. Finland leads with up to 57.65%, followed closely by Denmark at 55.9% including additional municipal tax. These rates apply to highest earners and may exclude local taxes or vary by residency.
Selected Asia–Pacific & Other Countries
|
Country |
Top Personal Income Tax Rate |
|---|---|
|
Australia |
45% |
|
Japan |
45% plus local surtaxes (often cited 55 % combined in some sources) |
|
China |
45% |
|
South Korea |
45% |
|
India |
30–42 % (varies with surcharge regimes; not top global level) estimate based on common rates |
|
Singapore |
24% |
|
Malaysia |
30% |
|
New Zealand |
39% |
|
Philippines |
35% |
Austria imposes 55% until 2029, Japan reaches 55.95% with surtax, and Sweden applies 52%. Aruba stands out at 52%, while Iceland hits 46.28% plus municipal tax. Effective top rates often include surcharges, as in India's new regime at 39%
Asia generally has lower top statutory rates than Western Europe, though some countries (e.g., Japan and China) still reach mid-40s at the headline level.
🇺🇸 United States : At the federal level, the U.S. top marginal rate is 37% (2025), but can exceed this when combined with state taxes (e.g., California 13.3%).
European countries generally have the highest headline rates : Many Western and Northern European nations have top marginal income tax rates above 45 %, with Denmark and Finland exceeding 50 %.
Asia and Pacific show more variability : Developed Asia economies (Japan, Australia) have mid-40s top rates, while smaller economies often cap nearer 30–35 %.
Tax rate ≠ total tax burden : Nominal top rates do not include Social security contributions, Local/state taxes, Deductions/exemptions, Effective tax burden post allowances. Thus, two countries with similar marginal rates can have very different effective burdens
Summary (Examples of Top Rates)
|
Region / Country |
Top Statutory Rate |
|---|---|
|
Denmark |
56% |
|
France / Spain |
54–55% |
|
Netherlands / Sweden |
49–52% |
|
Germany / Italy / Australia |
45–48% |
|
USA (Federal) |
37% (+ state adds) |
|
India / Singapore |
30–24% |
India Context
India's top rate under the new regime reaches 39% (30% base + 25% surcharge + cess) for high earners, revised in Budget 2025 with slabs up to ₹24 lakh at progressive rates before 30%. The old regime caps at 42.744% including higher surcharges
High-tax countries (45%+) : Predominantly in Europe, where progressive taxation supports extensive social welfare systems.
Mid-range countries (27.5%–45%) : A balanced approach is seen across many developed and emerging economies, combining revenue needs with competitiveness.
Zero personal income tax (0%) : Found mainly in select Gulf and offshore jurisdictions, often used as a lever to attract global talent, capital, and headquarters.
Why This Comparison Matters
A Balanced Perspective on Personal Income Tax Rates : Higher personal income tax in many countries is not merely a cost—it is often an investment in a comprehensive social ecosystem. In several high-tax economies, education is largely state-funded, Healthcare is universal and affordable, Public safety, security, and social insurance are robust, Citizens benefit from strong unemployment support, pensions, and social mobility
In such systems, higher taxes substitute out-of-pocket private spending, creating long-term financial and social stability. At the same time, the numbers also highlight why zero-tax or low-tax jurisdictions are attractive More capital retained for reinvestment and growth, flexibility for entrepreneurs and global businesses, and strategic hubs for scaling, IP holding, and cross-border operations.
The Real Takeaway for Business Builders Tax rates should never be viewed in isolation. What matters is the net value equation—taxes paid versus public services received and capital available for growth. For founders, investors, and globally mobile professionals, these comparisons help answer:
-
Where should I build?
-
Where should I scale?
-
Where does long-term value truly lie?
This perspective is especially relevant when advising on cross-border structuring, global expansion, and residency planning.
- Business planning & global expansion: Talent costs, compensation structuring, and location strategy depend heavily on PIT regimes.
-
Individual financial decisions: Net take-home pay, mobility, and residency choices are directly impacted.
-
Policy insight: Headline rates don’t equal effective tax—social security, deductions, and local taxes can materially change outcomes.
-
Tax competitiveness is not just about the rate—it’s about the total tax burden and the ecosystem that comes with it.