Analyze a company in less than 5 minutes via using Ratio
Page Contents

How to do a company analysis in less five minutes: Examine the following ratios:
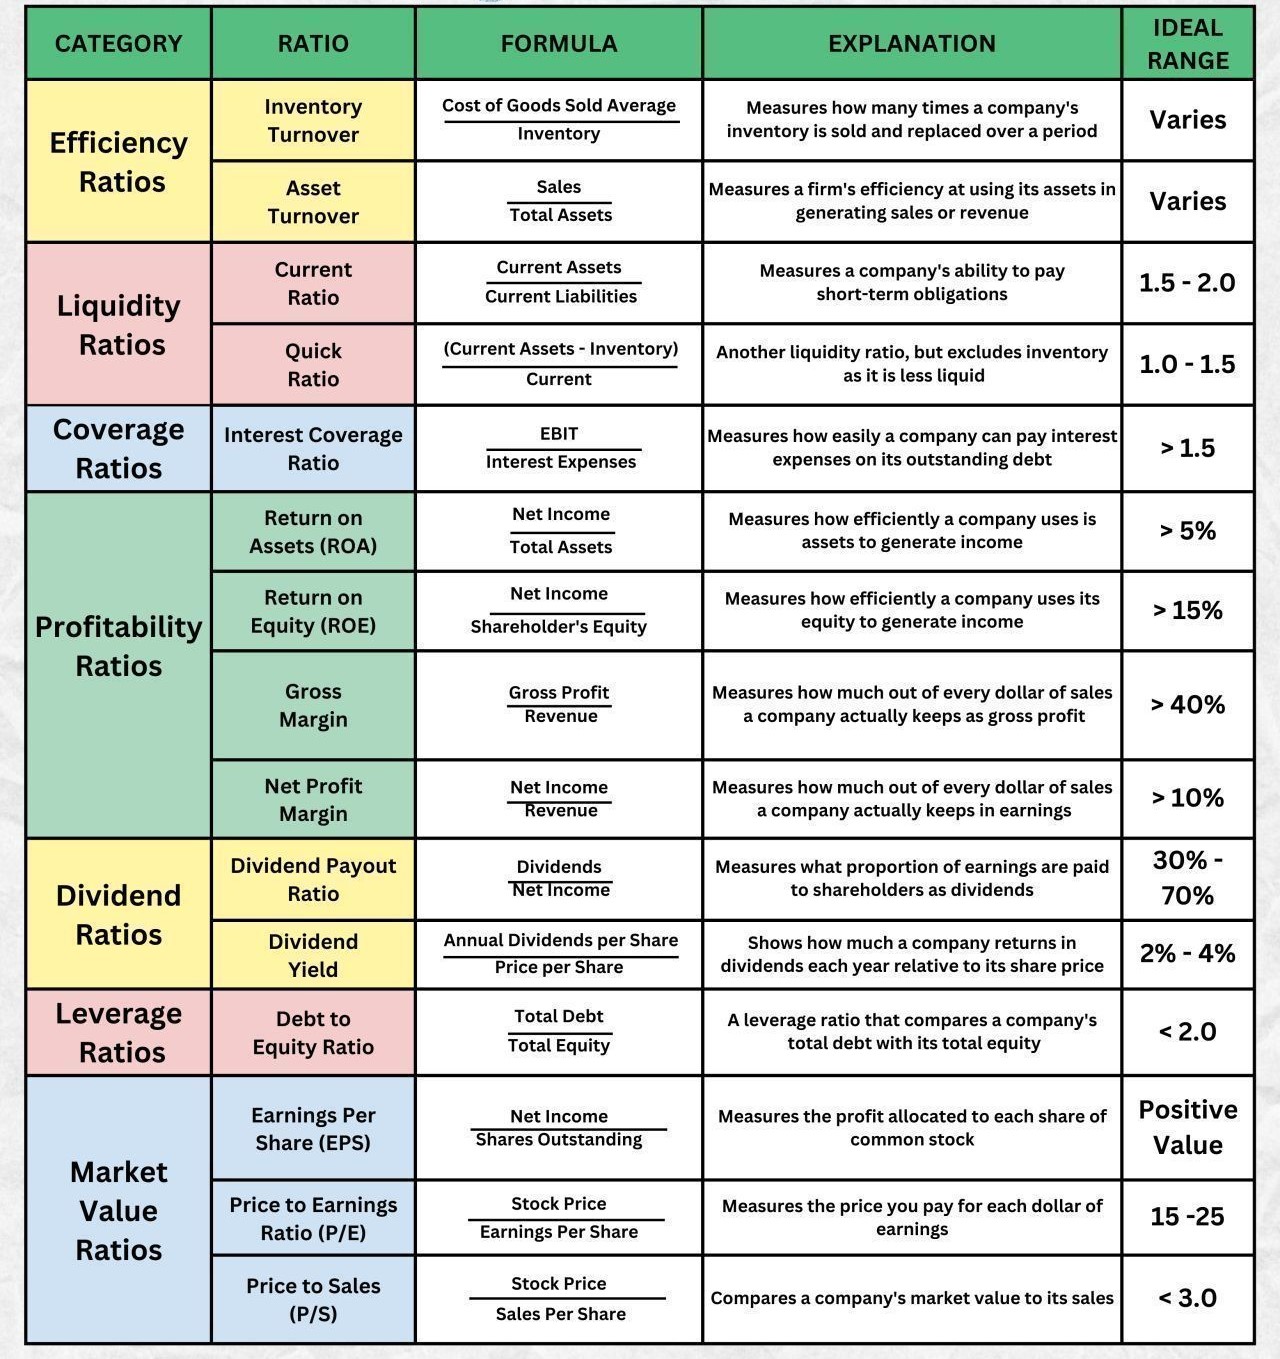
Efficiency Ratios
• Inventory Turnover:
Cost of Goods Sold ÷ Inventory
Measures how many times a company’s inventory is sold and replaced over a period.
• Asset Turnover:
Sales ÷ Total Assets
Measures a firm’s efficiency at using its assets in generating sales or revenue.
Liquidity Ratios
• Current Ratio:
Current Assets ÷ Current Liabilities
Measures a company’s ability to pay short-term obligations.
• Quick Ratio:
(Current Assets – Inventory) ÷ Current
Another liquidity ratio, but excludes inventory as it is less liquid.
Coverage Ratios
• Interest Coverage Ratio:
EBIT ÷ Interest Expenses
Measures how easily a company can pay interest expenses on outstanding debt.
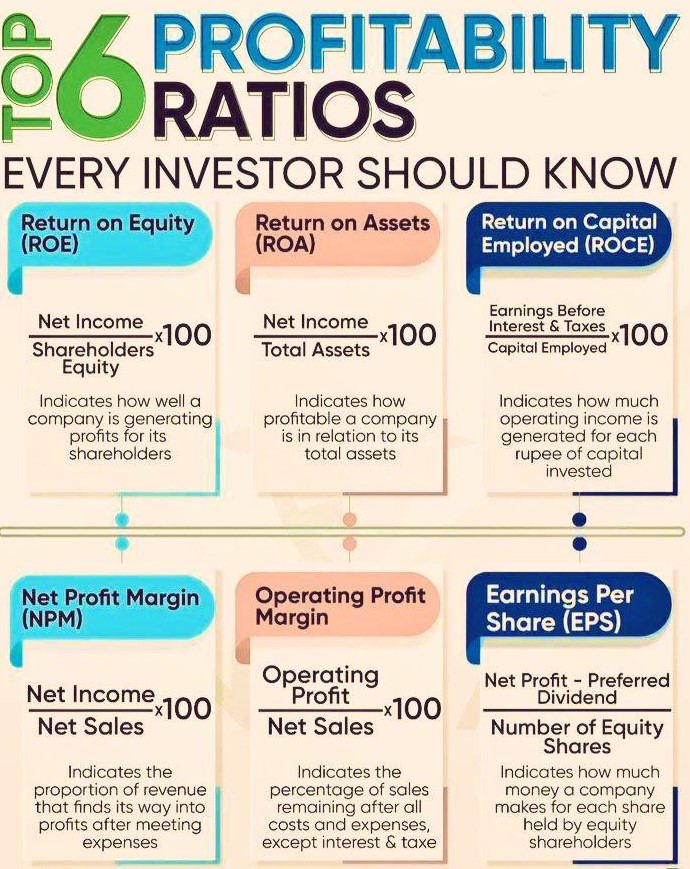
Profitability Ratios
• Return on Assets (ROA):
Net Income ÷ Total Assets
Measures how efficiently a company uses its assets to generate income.
• Return on Equity (ROE):
Net Income ÷ Shareholder’s Equity
Measures how efficiently a company uses its equity to generate income.
• Gross Margin:
Gross Profit ÷ Revenue
Measures how much out of every dollar of sales a company keeps as gross profit.
• Net Profit Margin:
Net Income ÷ Revenue
Measures how much out of every dollar of sales a company keeps as earnings.
Dividend Policy Ratios
• Dividend Payout Ratio:
Dividends ÷ Net Income
Measures what proportion of earnings are paid to shareholders as dividends.
• Dividend Yield:
Annual Dividends per Share ÷ Price per Share
Shows how much a company returns in dividends each year relative to its share price.
🛠️ Leverage Ratios
• Debt to Equity Ratio:
Total Debt ÷ Total Equity
A leverage ratio that compares a company’s total debt with its total equity.
Market Value Ratios
• Earnings Per Share (EPS):
Net Income ÷ Shares Outstanding
Measures the profit allocated to each share of common stock.
•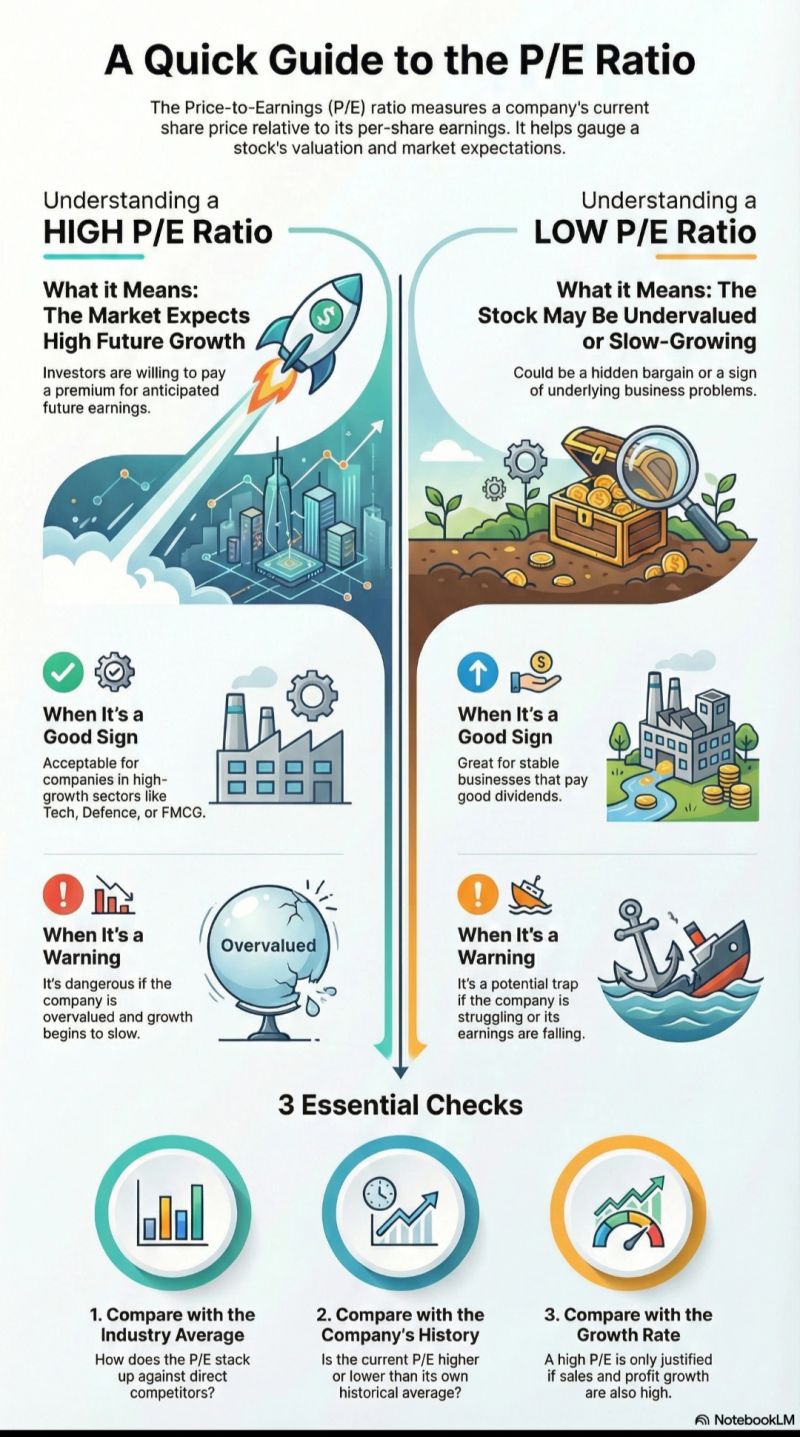 :
:
Share Price ÷ Earnings per Share
Measures the price you pay for each dollar of earnings.
• Price to Sales (P/S):
Share Price ÷ Sales Per Share
Compares a company’s market value to its sales.
Important Elements of Finance in RATIO and Analysis of Financial Statements
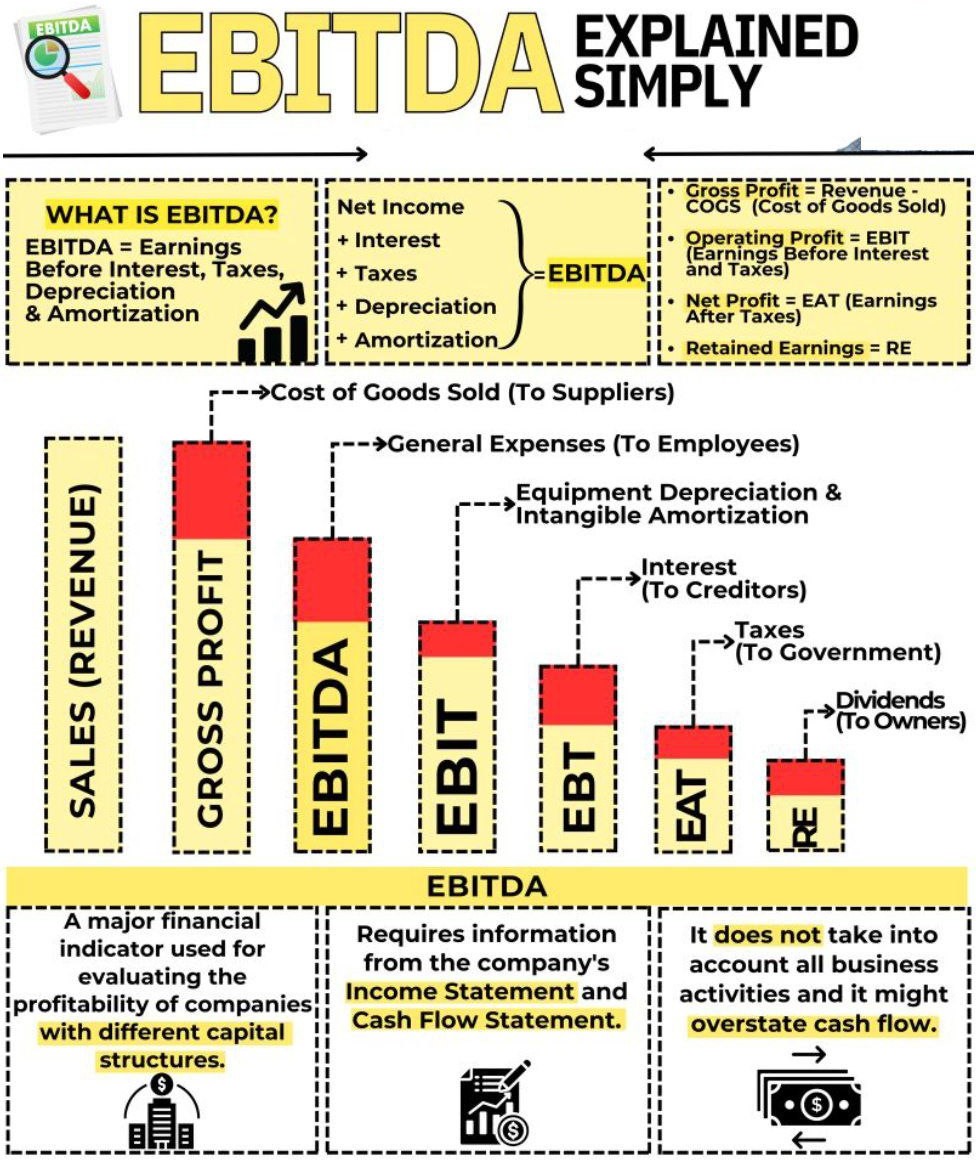
EARNINGS BEFORE INTEREST, TAXES, AND AMORTISATION (EBITA)
Investors use earnings before interest, taxes, and amortisation (EBITA) as a gauge of a company’s profitability. Comparing one business to another in the same industry might be useful. It occasionally can also offer a more realistic assessment of a company’s worth.
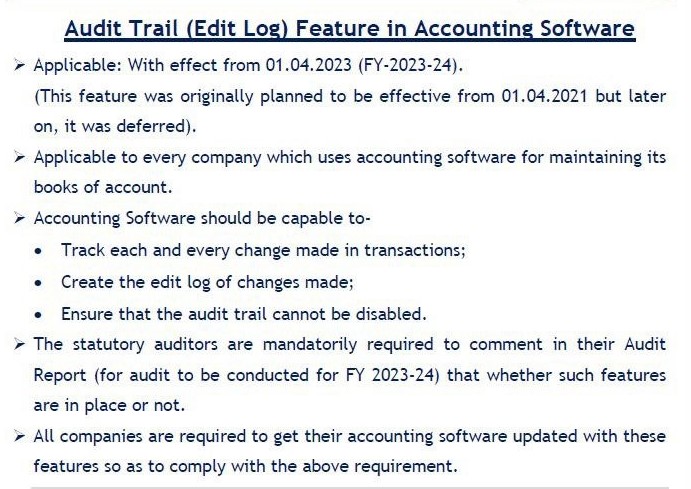
Penalty for Default
- According to the section 128 of the companies Act,2013 the officer who is in default must be punishable with an imprisonment which may extend to one year or with a fine of INR 50,000 and which may extend to INR 5,00,000 also.
- The Officer, who is in default, means the Managing Director, the whole-time director in charge of finance, the CFO or any other person of a company charged by the Board complying with the provisions of section 128 of the companies Act, such managing director, whole time director in charge of finance, CFO or any other person of the company.

95% of people read an Annual Report the WRONG way or close it after seeing the number of pages.
Are you one of them? Let’s find out
- Are you just looking at the numbers, or truly understanding what they reveal?
- Are revenues growing steadily, or is profitability just a one-time spike?
- Is the company financially strong, or sitting on hidden risks like excessive debt or inflated goodwill?
- Is the company generating real cash, or just showing profits on paper?
- Are you tracking the right metrics — or just guessing?
- Is the stock actually undervalued, or cheap for a reason?
Understanding these fundamentals can mean the difference between a smart investment and a costly mistake.
Check out the attached carousel to strengthen your analytical fundamentals.
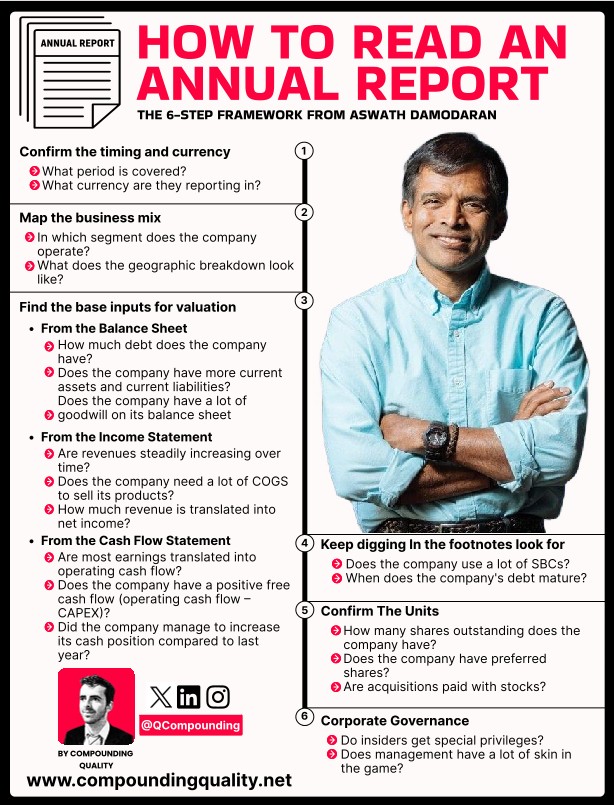
6-Step Framework by Aswath Damodaran: How to Read an Annual Report Effectively
1️⃣ Confirm the Timing and Currency
• Identify the reporting period.
• Check the currency used in financial statements.
2️⃣ Map the Business Mix
- • Understand the operating segments.
- • Review the geographic breakdown of operations.
3️⃣ Find the Base Inputs for Valuation
- Balance Sheet:
- Debt levels
- Current assets vs. liabilities
- Presence of goodwill
- Income Statement:
- Revenue trends
- Cost of Goods Sold (COGS)
- Net income margins
- Cash Flow Statement:
- Operating cash flow vs. earnings
- Free cash flow (Operating CF – CAPEX)
- Changes in cash position
4️⃣ Footnotes Analysis
Look for:
- Stock-based compensation (SBC)
- Debt maturity timelines
5️⃣ Confirm the Units
- Shares outstanding
- Preferred vs. common shares
- Stock-based acquisitions
6️⃣ Corporate Governance
- Insider privileges
- Management ownership and incentive structure
Rajput Jain and Associates : Service Offerings
We offer a comprehensive suite of professional accounting and compliance services, including:
Accounting & Bookkeeping
-
Day-to-Day Bookkeeping and Accounting
-
Payment, Receipt & Journal Entry Recording
-
Bank Reconciliation Statements (BRS)
-
Vendor and Customer Ledger Reconciliation
Sales, Purchases & Inventory
-
B2B/B2C Sales & Purchases with E-Invoicing
-
Debit/Credit Notes & Stock Transfers
-
Bill of Materials (BOM) Management
-
Stock Register Maintenance & Statements
Statutory Compliance
-
GST Return Filing (Monthly)
-
TDS Return Preparation & Filing
-
ESI & EPF Monthly Payments
Payroll & HR Support
-
Salary Sheet Preparation (Excel-based)
-
Vendor Registration Documentation Support
Accounts Management
-
Accounts Payable (AP) Management
-
Accounts Receivable (AR) Monitoring
Software Expertise : We are proficient in handling various accounting and ERP platforms, including Tally | Busy | SAP | Zoho Books | QuickBooks | Finncub | Enjoy